ata Touch is an advanced solution that brings together insights from database discovery and activity monitoring applications, enabling secure tracking and in-depth analysis of your data. With its built-in visualization features, Data Touch allows users to quickly understand their data through interactive graphs and maps.
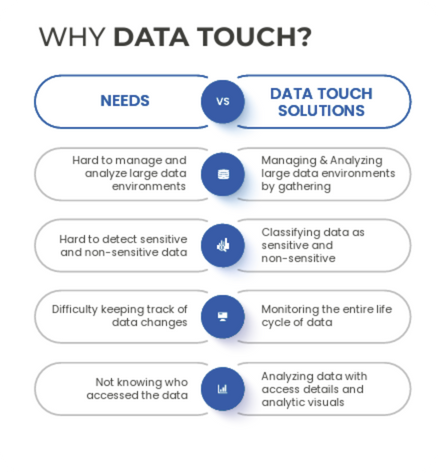
Effectively monitoring sensitive data is crucial for protecting personal information and preventing misuse—especially in large-scale data environments where sensitive data can be difficult to track. Data Touch addresses this challenge by seamlessly integrating with both database discovery and activity monitoring tools, combining their strengths to deliver a robust and reliable data tracking experience.
Key Capabilities:
- Monitors sensitive data across your environment
- Regulates and audits data usage
- Visualizes data with intuitive charts and maps
- Provides a clear overview of the ten most recent scanned projects on the main dashboard
By leveraging classified data—distinguishing between sensitive and non-sensitive information—Data Touch presents project-based visualizations, making it easy to access and interpret critical data insights. This empowers users to make informed, data-driven decisions while maintaining the highest standards of data security and privacy.
Data Touch Tool Capabilities
- Analyze previously detected and classified data (both sensitive and non-sensitive), and visualize results with interactive graphs.
- Display application-level access to any data within a selected time frame, revealing who accessed the data, how it was used, and providing full query details.
- Track data lineage and visualize the complete lifecycle of your data assets.
- Generate comprehensive, visual reports for all data insights.
- Utilize data heatmaps for quick identification of data usage patterns.
- Detect abnormal user behavior using advanced AI and machine learning algorithms.
Data Touch Features
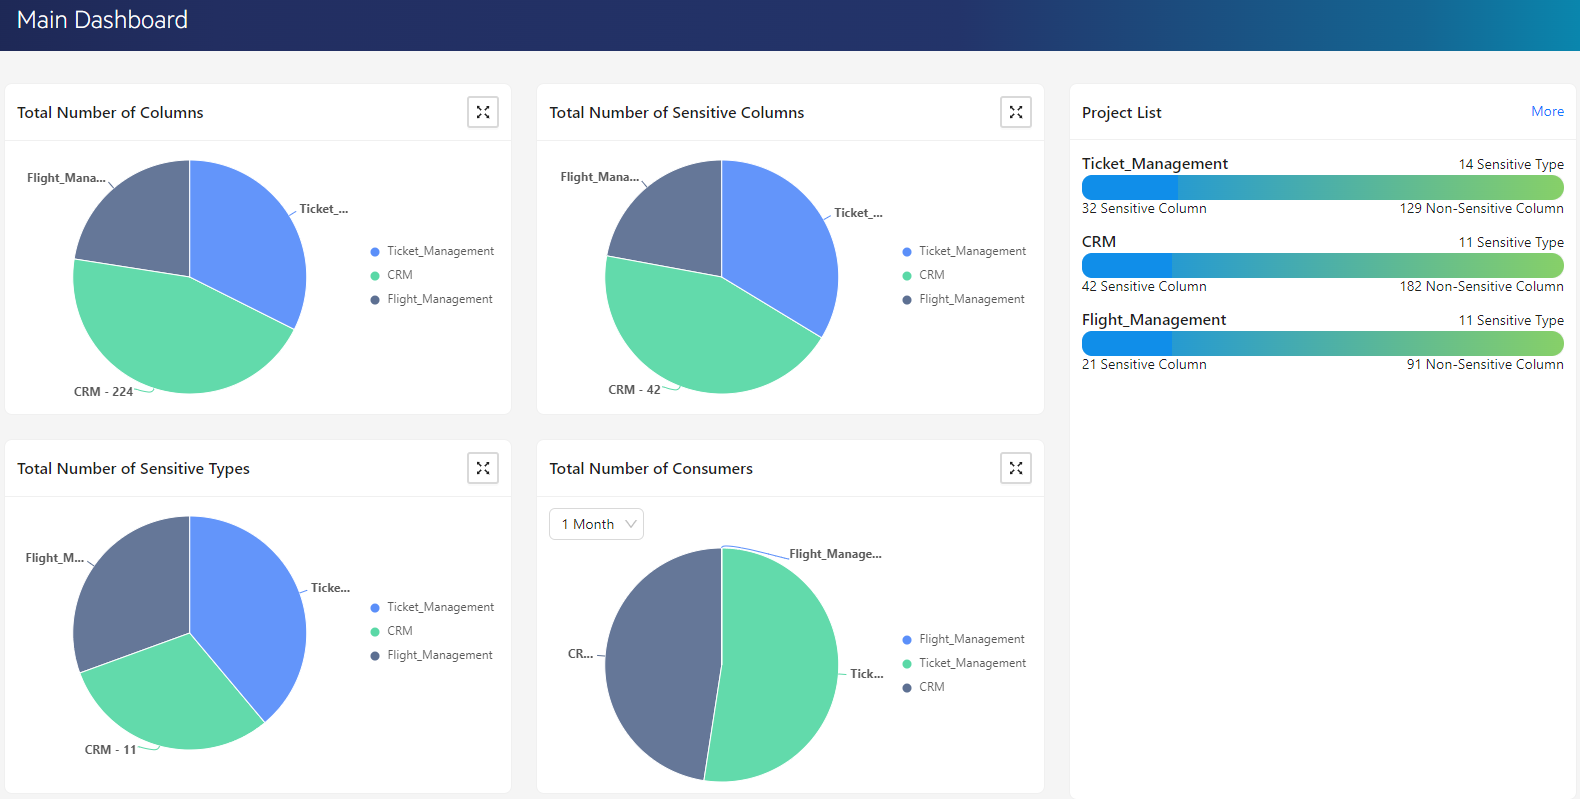
Visualization:
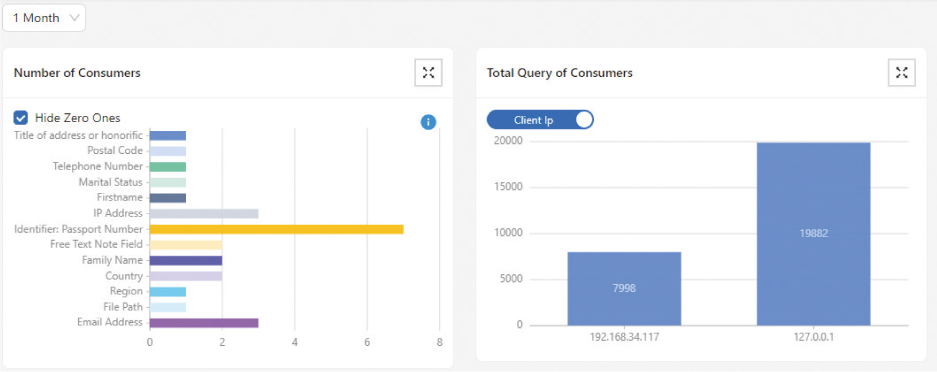
Data Touch displays all projects discovered within your environment on purpose-built charts, providing detailed information at a glance. Projects are ranked by size, and the dashboard presents clear graphs of classified data (sensitive and non-sensitive), sensitive data types, and data consumers. This enables users to quickly interpret and act on critical data insights.
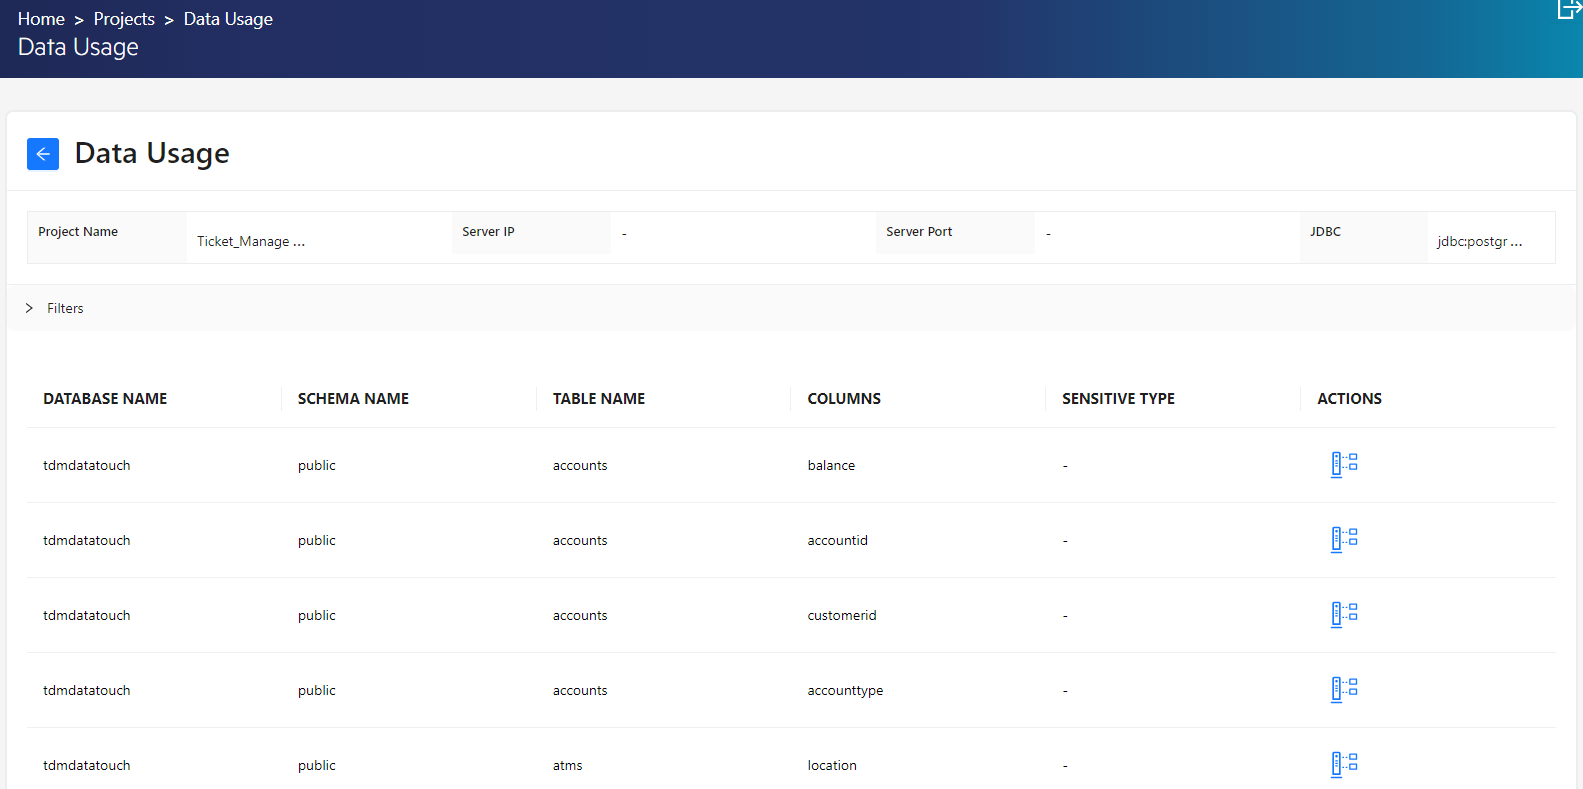
Data Usage: Shows projects (scanned by Discovery), consumers (who touched the data), in detail how and when they touched. By entering a date range, these details can be filtered. Tables can be filtered and exported via Excel.
Data Analysis: Shows the details of the queries for the project in three ways:
- Query details,
- Queries made,
- Queries for sensitive types
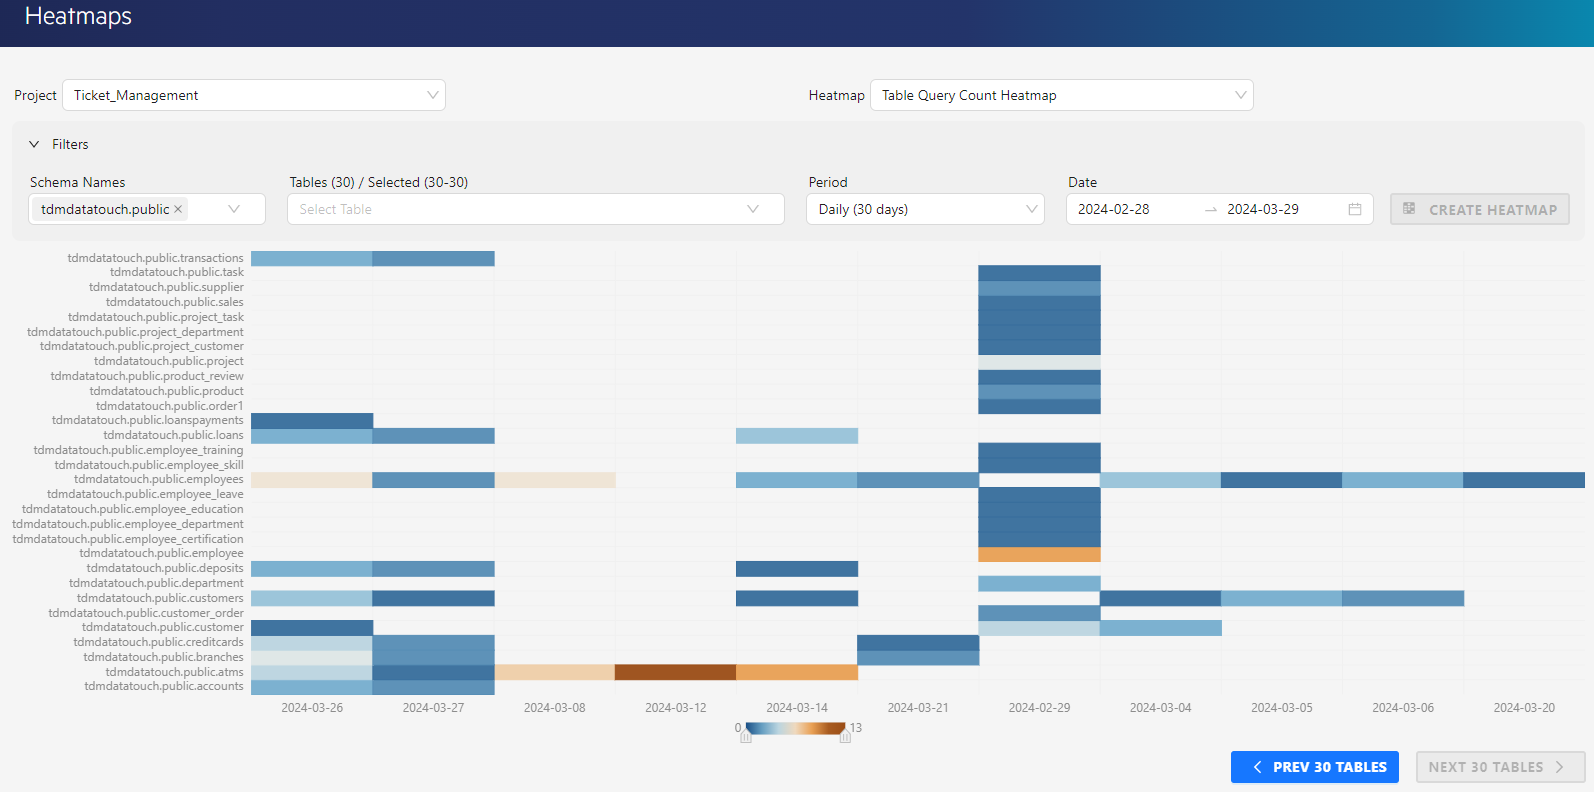
Data Heatmaps: Creates different heatmaps with predefined options for more detailed analysis of all kinds of data within the application.
- Table Query Count Heatmap: Shows the total query number for each table for a specific date.
- Application Count Heatmap: Shows the total query number accessed from each application to each table.
- Table Action Type Count Heatmap: Shows the total query number by action type (select, update, delete, etc.) for each table.
- Sensitive Type Time Heatmap: Shows the total query number within the selected period for each sensitive type.
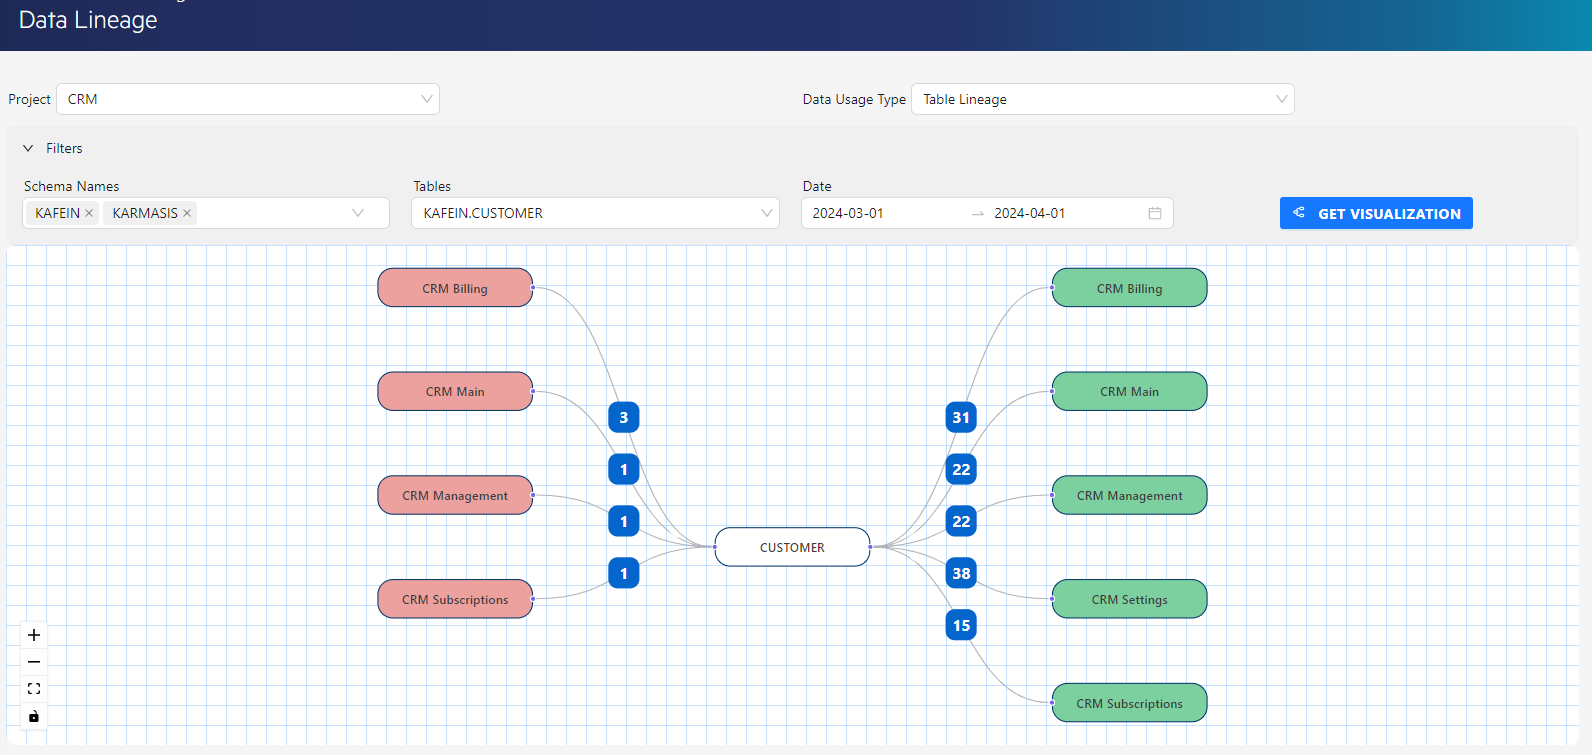
Data Lineage: Data Lineage creates a map showing all stages, changes, and relationships a table, column, or application goes through, starting from its source. It provides the ability to track the paths where data is created, used, modified, and transferred.The solution provides detailed understanding of data origin, usage, and changes within data management processes.
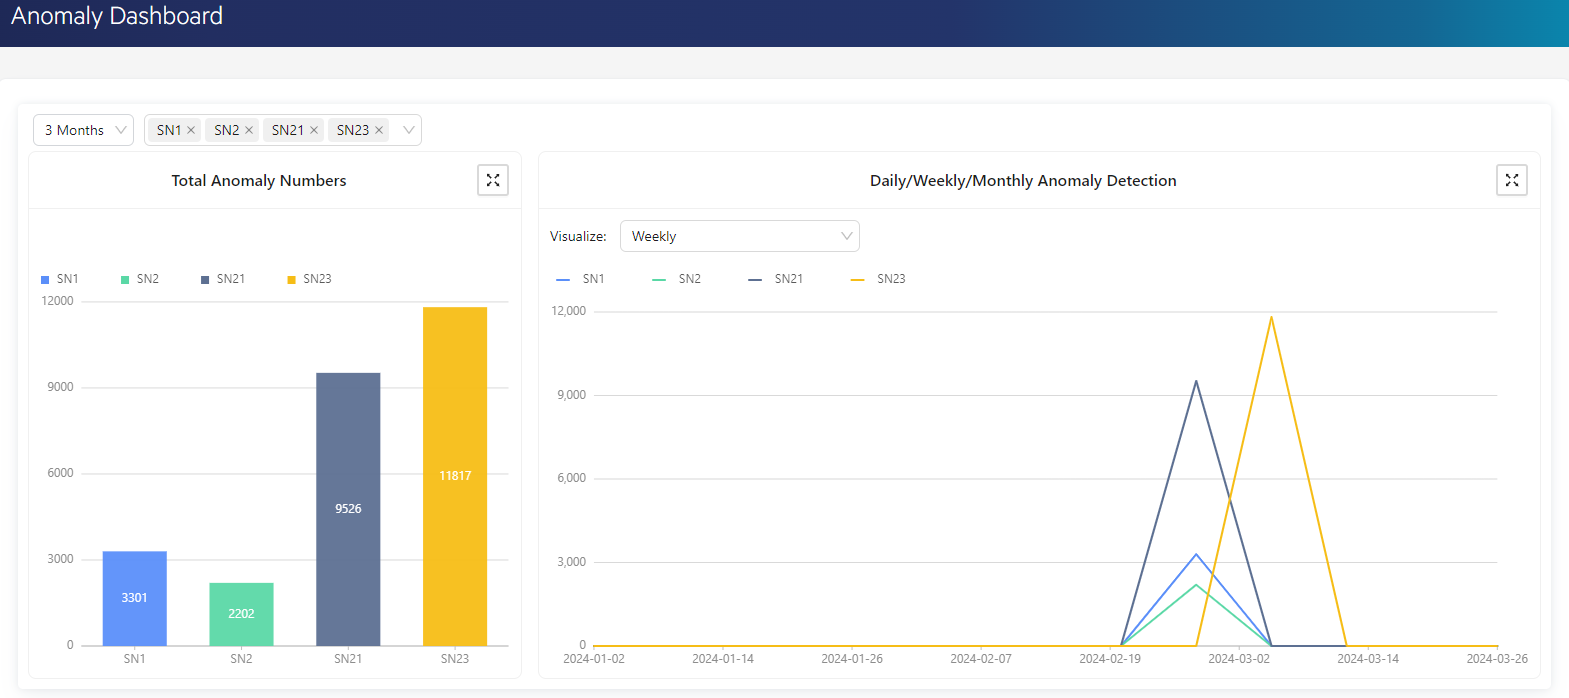
Anomaly Detection: The Anomaly Engine can detect abnormal conditions from the perspective of users or data sources by analyzing usage data from data sources in real-time. Its purpose is to identify unusual behaviors, outliers, or potential threats that may indicate errors, security breaches, or performance issues.
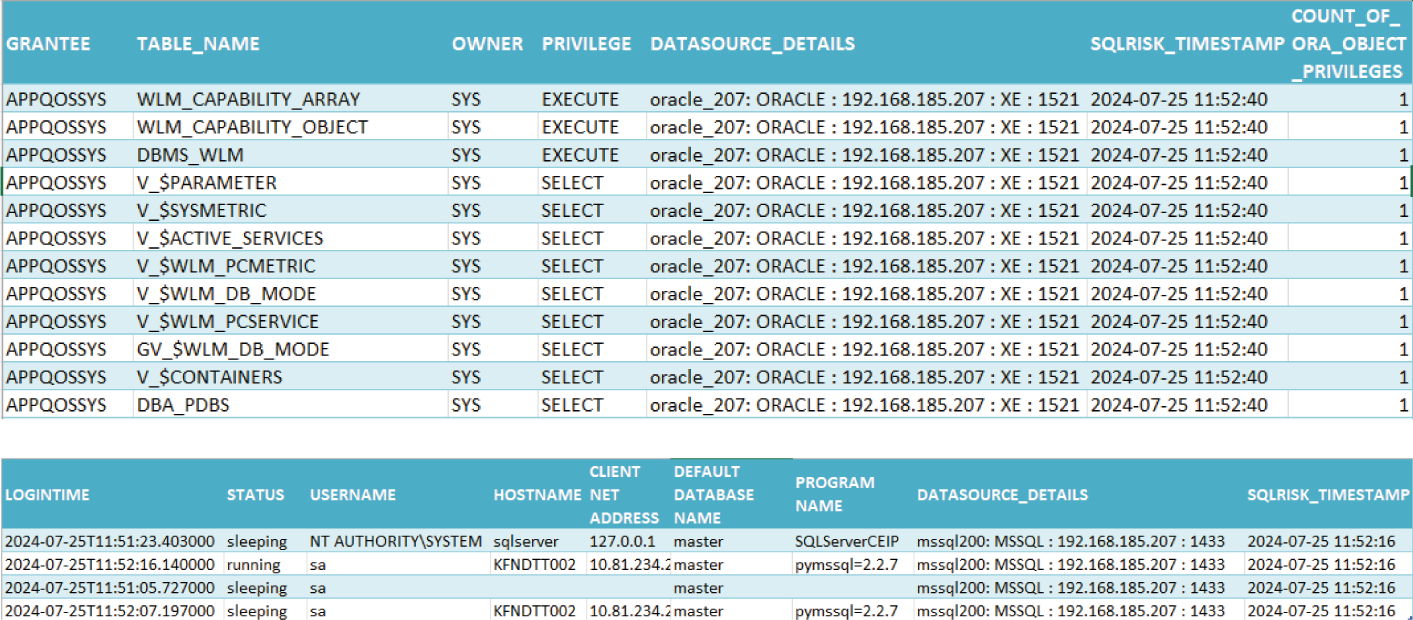
Data Source Spectrum Reports: Provides extensive user privilege reports for various databases including Oracle, MS SQL, PostgreSQL, MySQL and MongoDB .Reports include user roles, altered privileges, login times, number of administrators and many more.